You spend hours improving articles. You join discussions on talk pages. You mentor new editors. But how do you know if your WikiProject is actually succeeding? It feels like running a marathon without mile markers. Many community leaders struggle with this exact question because volunteer work often resists traditional measurement.
This isn't just about counting numbers for the sake of it. When you manage a WikiProject, a group within Wikipedia that coordinates the collaborative editing and assessment of a specific subject area, you need to understand health versus activity. Are you gaining new contributors? Are you actually improving the quality of knowledge available to readers?
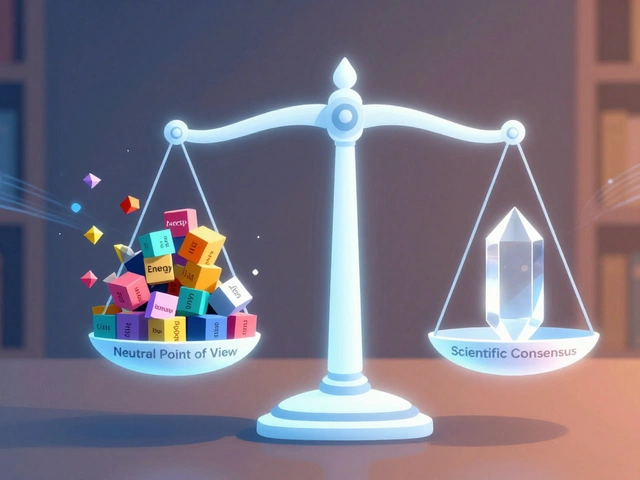
Defining Success in a Voluntary Environment
SUCCESS looks different depending on who you ask. A researcher might care about coverage gaps filled. An administrator might care about vandalism reverts. A general editor might care about citation counts. To get a real picture, you have to separate input from output. Input is what people do; output is what gets created or improved.
If you only track edits, you miss the quality of those edits. If you only track article ratings, you ignore the effort required to reach that rating. The goal is to find a balance between encouraging participation and ensuring accuracy.
- Community health indicators show long-term sustainability.
- Quality improvements signal value to readers.
- Efficiency metrics help prevent burnout among core maintainers.
You also need to consider the timeline. A spike in activity might mean a crisis (vandalism surge) rather than growth. Context matters immensely when interpreting data points.
Tracking Activity Metrics
Activity metrics tell you about the energy flowing through your project. These are the easiest to capture but the trickiest to interpret meaningfully. The most common metric is the Edit Count. This number represents every single save action taken on pages within your scope. However, a bot reverting spam five times counts as five edits. Does that equal five hours of human contribution? No.
Edit Count measures the frequency of changes made to content, but it does not distinguish between significant revisions and minor corrections.You should filter for unique editors instead. Seeing ten unique users contributing over a week is healthier than seeing one user making a thousand tiny edits. This indicates knowledge distribution rather than dependency on a single power user.
Talk page activity is another vital signal. Most serious coordination happens outside the main article space. When editors argue about sourcing standards on a project discussion board, that is productive friction. High activity on the project portal suggests healthy debate. Silence can mean two things: total agreement or complete apathy. Distinguishing between them requires reading the sentiment, not just the volume.
Evaluating Output Quality
While activity shows effort, output proves results. In the world of Wikipedia, the free online encyclopedia powered by MediaWiki software, quality is usually defined by the Assessment Scale. Articles move from Stub status up to B-Class, Good Article (GA), and eventually Featured Article (FA).
| Metric Type | Example Data Point | What It Reveals |
|---|---|---|
| Activity | Daily Edits | Current Engagement Level |
| Activity | New Editors | Recruitment Health |
| Output | Citations Added | Factual Reliability |
| Output | Featured Articles | Exemplary Standards Met |
A Featured Article represents the highest tier of quality. Reaching this level means the piece has passed rigorous peer review. Tracking how many FAs your project creates over time is a strong proxy for impact. However, this is a slow process. Expecting immediate results can demotivate volunteers.
Citation counts are more granular. Adding a reference is tangible proof of work. If you see the average number of references per article rising, you are increasing the trustworthiness of the corpus. This is often more useful to external stakeholders than abstract class ratings.

Tools for Measuring Impact
You cannot do this manually for thousands of pages. You need automated systems. Most dedicated administrators rely on Toolforge, a cluster of machines hosting tools and scripts for Wikimedia projects. This platform allows you to run SQL queries directly against database dumps.
If you aren't comfortable with code, you can use pre-made dashboards. Tools like "WikiStats" aggregate data across namespaces. They show you trends over months or years. You can slice this data by date, by username, or by topic category.
The Page View API offers another angle. Just because an article exists doesn't mean anyone reads it. High page views on a poorly rated article suggest high demand for quality. Prioritizing those specific articles for improvement yields the best return on investment for your team's time.
Data visualization helps here. A simple line chart showing active contributors per month tells a story better than a spreadsheet. A sudden drop might indicate a controversy or seasonality. Visual cues trigger faster investigation.
Avoiding Vanity Metrics
There is a danger in measuring the wrong things. This phenomenon, often called the Goodhart's Law effect, happens when a measure becomes a target and ceases to be a useful measure. If you incentivize edits above all else, you get edit wars and trivial updates.
Focus on sustainable growth metrics. One metric that genuinely reflects community health is retention rate. How many new editors return after their first week? Volunteer, an individual who contributes unpaid labor to advance the goals of the organization retention costs less than recruitment. Keeping experienced mentors around is crucial.
Another pitfall is ignoring the Talk Page. Some projects obsess over main namespace edits while ignoring conflict resolution. Unresolved disputes drain morale faster than any backlog. Checking conflict metrics-such as revert rates-can alert you to toxicity before it spreads.

Setting Realistic Benchmarks
Every project stage behaves differently. A newly formed group needs to focus on member acquisition. Their success is measured in sign-ups and initial templates. A mature group focuses on maintenance. Their success is keeping articles stable against vandalism.
Don't compare a niche science project to the main WikiProject Film. Scope and audience size vary wildly. Set internal benchmarks based on your own historical data. If you typically produce two Good Articles a year, setting a goal for fifty is unrealistic and sets the team up for failure.
Benchmarks should also account for seasonal trends. Wikipedia traffic drops significantly in December and spikes back up in January. Comparing December activity to June will always show a loss. Adjust your expectations based on these natural cycles.
Balancing Effort and Outcome
Finally, remember that humans are not machines. Burnout is the biggest threat to long-term success. Constant monitoring of metrics can turn a hobby into a job. Leaders must recognize when to stop checking the dashboard and focus on mentoring.
Qualitative feedback remains valuable. Sometimes a single conversation on IRC or Discord reveals more about morale than a monthly report. Combine your hard data with regular check-ins. This ensures your measurements reflect the reality of the people doing the work.
Conclusion on Metric Use
Using metrics effectively requires discipline. Pick three to five key indicators that align with your current goals. Stick to them. Don't let new trends distract you until the current cycle completes. Consistency creates a baseline you can actually learn from.
Success in a collaborative environment is cumulative. Small improvements add up. By tracking both what you do (activity) and what you achieve (output), you build a resilient community capable of enduring years of change. Keep your eyes on the mission, not just the numbers.
How often should I check WikiProject statistics?
Weekly reviews are sufficient for most active projects. Daily checking often leads to noise and short-term anxiety without providing actionable insights for strategy changes.
Is edit count the best metric for productivity?
No, raw edit count is misleading because bots and minor tweaks inflate the number. Unique contributor counts and substantive changes provide a clearer picture of real productivity.
What tool is best for visualizing data?
Toolforge offers robust querying options for advanced users, while WikiStats provides easier-to-read charts for beginners looking at traffic and edit history trends.
Why do page views matter for success?
High page views indicate demand. Improving popular articles ensures that your work reaches the largest possible audience, maximizing the impact of your community's efforts.
Can I use these metrics to rank individual editors?
Ranking individuals is generally discouraged as it fosters competition rather than collaboration. Focus metrics on collective project health to maintain a supportive volunteer environment.