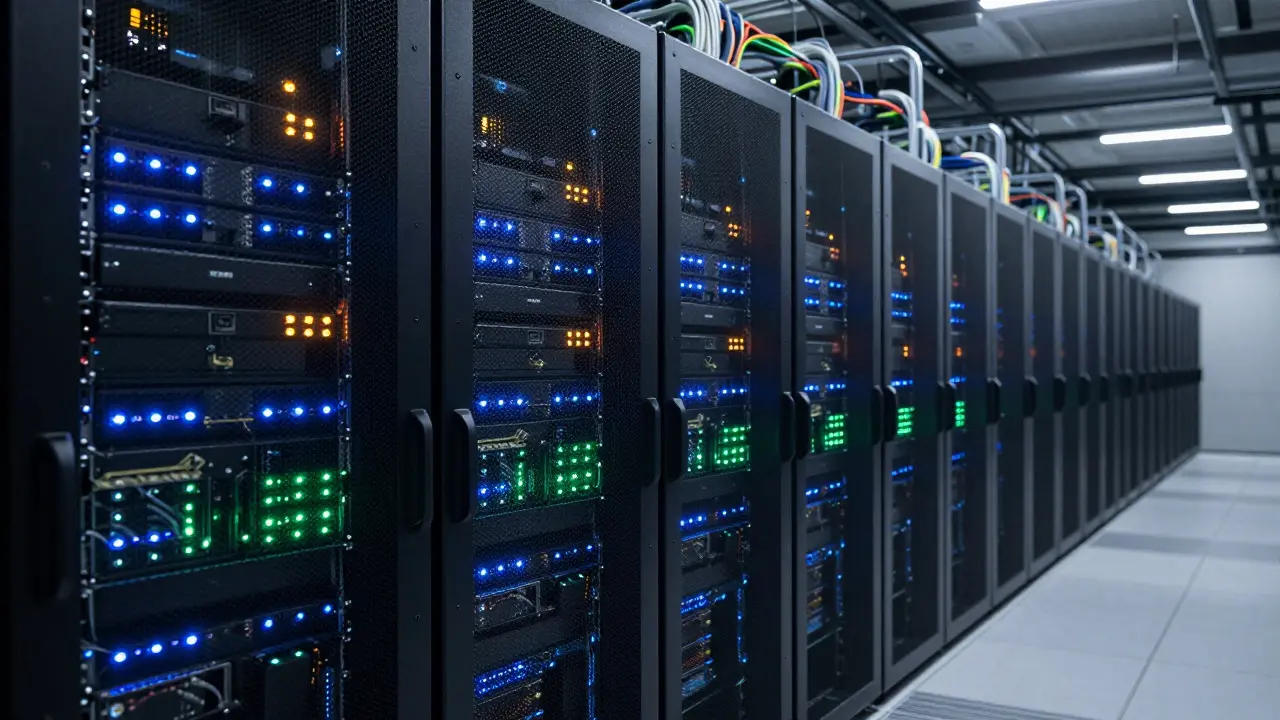
Every time you search for a fact on Wikipedia is a free online encyclopedia that relies on volunteer editors and complex backend systems to serve billions of readers. You might think it’s just text on a screen, but behind the scenes, a massive machine is working overtime. It tracks who is looking at what, how long they stay, and which links they click. This isn’t about spying on you; it’s about keeping the site alive. The infrastructure that powers this is known as the analytics pipeline, a series of automated processes that collect, clean, and store data from millions of daily visitors.
For most people, these pipelines are invisible. But for engineers and data scientists, they are the heartbeat of the platform. If the pipeline breaks, we lose insight into reader behavior. If the data is messy, we can’t improve the user experience. In this article, we’ll break down exactly how these systems work, focusing on two main data streams: pageviews and clickstream logs. We’ll look at the tools used, the challenges involved, and why this matters for anyone who cares about open knowledge.
Why Data Matters for an Open Encyclopedia
You might wonder why a non-profit organization needs such heavy-duty data infrastructure. The answer is simple: scale. Wikipedia serves over 500 million unique devices every month. That’s a lot of traffic to manage without crashing or slowing down. The data collected helps the Wikimedia Foundation make informed decisions. For example, if pageview data shows that a specific language version is growing rapidly, they can allocate more server resources to that region. If clickstream data reveals that users frequently drop off after reading the first paragraph, editors can restructure articles to be more engaging.
This data also helps combat vandalism and improve search results. By understanding how users navigate between pages, developers can tweak the internal linking structure to make content easier to find. Without these insights, the site would be flying blind. The analytics pipeline acts as the eyes and ears of the platform, providing real-time feedback on what works and what doesn’t.
The Anatomy of a Pageview Pipeline
Let’s start with the basics: pageviews. A pageview is recorded every time a user loads a Wikipedia article. It’s the simplest form of data collection, but processing it at scale is no small feat. The process begins at the edge servers, where web requests are handled. When a browser requests an article, the server logs the event. This log entry includes the URL, the timestamp, the user agent (which tells us if it’s a mobile phone or desktop), and sometimes the referrer (where the user came from).
These raw logs are then streamed in real-time to a central processing hub. Historically, this was done using custom scripts, but today, much of this work is handled by modern streaming platforms. The data flows through a message queue, often using Apache Kafka, which allows multiple consumers to read the same stream without interfering with each other. One consumer might calculate real-time statistics for the dashboard, while another might archive the data for long-term historical analysis.
Once the data reaches the processing layer, it gets cleaned. Raw logs are messy. They contain bot traffic, duplicate entries, and errors. The pipeline filters out known bots using lists maintained by the community. It also deduplicates events to ensure that a single user refreshing a page doesn’t count as five separate views. After cleaning, the data is aggregated. Instead of storing every single view, the system groups them by hour, day, or week, and by article. This aggregation makes the data manageable and fast to query.
Clickstream Data: Digging Deeper into User Behavior
Pageviews tell us *what* people read, but clickstream data tells us *how* they read it. This is where things get more complex. Clickstream logging captures user interactions within the page, such as clicks on links, edits, or searches. Unlike pageviews, which are logged by the server, clickstream data is often captured by JavaScript running in the user’s browser. This means it depends on the user having JavaScript enabled and consenting to tracking (though Wikipedia uses privacy-preserving methods).
The challenge with clickstream data is volume and complexity. Every click generates a new event. If a user spends ten minutes on a page, clicking through five different links, that’s five separate records to process. These records need to be stitched together to form a session. A session represents a continuous period of activity by a single user. Defining a session is tricky because users might step away for five minutes and come back. Is that the same session? Usually, yes, if the gap is under thirty minutes. The pipeline uses logic to group these events into coherent sessions, allowing analysts to see the path a user took through the site.
Privacy is a huge concern here. To protect user identity, clickstream data is anonymized. Instead of using IP addresses, which can identify individuals, the system assigns random IDs to sessions. These IDs expire quickly, so they can’t be used to track a user over time. This approach balances the need for useful data with the right to privacy, a core value of the Wikimedia movement.

The Role of Bots and Automation in Infrastructure
You mentioned bots in the title, and for good reason. Bots aren’t just for editing articles; they are crucial for maintaining the analytics infrastructure itself. In the context of data pipelines, "bots" often refer to automated scripts that run continuously to monitor health, process data, and generate reports. For example, a monitoring bot might check if the data flow has stopped. If the number of incoming events drops below a certain threshold, it triggers an alert to the engineering team. This prevents silent failures where data stops flowing but nobody notices until days later.
There are also maintenance bots that clean up old data. Storing every click ever made would require petabytes of storage. Instead, the pipeline archives older data into compressed formats and moves it to cold storage. This keeps the active database fast and responsive. Another type of bot handles data validation. It cross-checks the aggregated numbers against expected patterns. If the number of pageviews for English Wikipedia suddenly drops by 50% in an hour, the bot flags it as an anomaly. This could indicate a server outage, a code bug, or a change in user behavior. Early detection is key to fixing issues before they impact the public.
Tools and Technologies Powering the Stack
What actually runs all this? The stack is a mix of open-source tools and custom software. At the heart of the data processing is Apache Hadoop, specifically Hive, which allows SQL-like queries over large datasets. This is perfect for historical analysis where you don’t need real-time results but want to ask complex questions like "How did pageviews for climate change topics change over the last decade?"
For real-time processing, the foundation has increasingly adopted Apache Spark and Flink. These engines can handle streaming data with low latency. They allow the team to compute metrics on the fly, such as current traffic spikes during a breaking news event. On the front end, the data is visualized using dashboards built with tools like Grafana or custom web interfaces. These dashboards provide a clear picture of site health, showing trends in traffic, error rates, and popular articles.
Storage is handled by a combination of databases. Time-series data, like pageviews per minute, fits well into specialized time-series databases that optimize for sequential writes and reads. Relational data, like user session details, might live in PostgreSQL or similar relational databases. The choice of technology depends on the specific use case, balancing speed, cost, and ease of management.
| Feature | Pageview Data | Clickstream Data |
|---|---|---|
| Source | Server-side logs | Browser JavaScript |
| Granularity | Per page load | Per interaction (click, scroll, edit) |
| Volume | High (billions/day) | Very High (multiple events per page) |
| Privacy Risk | Low (anonymized by default) | Medium (requires careful anonymization) |
| Primary Use | Traffic analysis, popularity ranking | User journey mapping, UX improvement |

Challenges in Maintaining Real-Time Accuracy
Building the pipeline is one thing; keeping it accurate is another. One of the biggest challenges is handling time zones. Wikipedia is global, so a "day" isn’t always aligned with UTC. Some analyses require local time, while others use UTC for consistency. The pipeline must handle these conversions correctly to avoid skewed data. Another issue is clock skew. If a server’s clock is slightly off, timestamps can be wrong, leading to gaps or overlaps in data. Regular synchronization with NTP (Network Time Protocol) servers helps mitigate this.
Data quality is also a constant battle. Sometimes, a software update changes the format of a log entry, breaking downstream parsers. The pipeline needs robust error handling to skip bad records without stopping the whole flow. Monitoring tools watch for these errors, and alerts are sent to developers when the error rate exceeds a safe limit. This proactive approach ensures that minor glitches don’t become major data loss events.
Future Directions: AI and Personalization
Where is this heading next? The Wikimedia Foundation is exploring how to use this data responsibly for personalization. Imagine a Wikipedia that suggests related articles based not just on static links, but on your actual reading patterns. If you read about quantum physics, the sidebar might suggest articles on string theory that other readers with similar interests have viewed. This requires sophisticated machine learning models that can process clickstream data in near-real-time.
However, personalization comes with risks. Too much customization can create echo chambers, where users only see content that confirms their existing beliefs. The goal is to strike a balance: enhancing discovery without narrowing perspective. As computational power grows and algorithms improve, the analytics pipeline will evolve from a passive recording device to an active intelligence layer, helping guide readers to deeper knowledge.
Frequently Asked Questions
Does Wikipedia track individual users?
Not in the traditional sense. While cookies and temporary IDs are used to distinguish sessions, the data is heavily anonymized. IP addresses are stripped or hashed, and identifiers expire quickly. The goal is to understand aggregate behavior, not to build profiles of specific individuals.
What happens if the analytics pipeline fails?
The website itself usually continues to function because analytics is decoupled from content delivery. However, real-time dashboards will stop updating, and long-term data collection may pause until the issue is fixed. Engineers prioritize restoring data flow to prevent gaps in historical records.
How is bot traffic filtered out?
Bots are identified using user-agent strings and behavioral patterns. Known crawler IPs are blocked or tagged. Heuristics detect unusual request rates or lack of mouse movement (for clickstream data). This filtering ensures that human-driven trends aren’t distorted by automated scraping.
Can anyone access Wikipedia’s raw data?
Aggregated data is publicly available through APIs and dumps. Raw, unprocessed logs are generally restricted to internal teams to protect privacy and performance. Researchers can apply for access to specific datasets under strict usage agreements.
Why is clickstream data more complex than pageview data?
Clickstream data involves multiple events per session, requiring state management to link clicks into a coherent journey. It also relies on client-side JavaScript, making it susceptible to browser differences and network interruptions, unlike server-logged pageviews which are more consistent.