
Did you know that Wikipedia is a free online encyclopedia with over 60 million articles across all languages? Beyond being a quick reference tool, it serves as a massive, open-access map of human knowledge. For researchers and data scientists, the links between articles aren't just for navigation-they are data points waiting to be mined. By analyzing these connections, we can perform citation network analysis, revealing how ideas spread, which topics are central, and where gaps in our collective understanding lie.
Why Use Wikipedia for Citation Networks?
Traditional citation networks rely on academic papers. Tools like Scopus or Web of Science track who cited whom in peer-reviewed journals. But this approach has blind spots. It misses popular science, historical context, and cross-disciplinary bridges that don't fit neatly into journal categories. Wikipedia fills this gap because its editing community actively curates links based on relevance and notability, not just formal publication rules.
When an editor links "Quantum Mechanics" to "Albert Einstein," they are asserting a strong semantic relationship. Multiply that by millions of articles, and you get a knowledge graph that reflects public interest and educational consensus. This makes Wikipedia an ideal proxy for studying how general knowledge is structured. You aren't just looking at what experts cite; you're looking at what society deems important enough to link together.
The Structure of Wikipedia's Link Graph
To analyze citations, you first need to understand the data structure. Wikipedia articles function as nodes in a directed graph. When Article A contains a hyperlink to Article B, it creates a directed edge from A to B. This isn't random. Studies show that highly linked articles (hubs) tend to represent foundational concepts, while poorly linked articles often indicate niche topics or areas needing expansion.
Consider the concept of centrality. In network theory, centrality measures how important a node is within the whole system. On Wikipedia, high in-degree centrality (many incoming links) usually signals broad recognition. High out-degree centrality (many outgoing links) suggests a comprehensive overview article. By mapping these degrees, you can identify the "backbone" of any subject area. For instance, in a subgraph focused on computer science, nodes like "Algorithm" or "Data Structure" will likely have massive connectivity compared to specific programming languages.
Extracting Data: From Raw HTML to Clean Edges
You don't need to scrape every page manually. The Wikimedia Foundation provides dumps and APIs specifically for this purpose. The most efficient method involves using the MediaWiki API or downloading XML dump files. These files contain the raw wikitext, including all internal links denoted by double square brackets, such as [[Python_(programming_language)]].
However, raw extraction is messy. Links might point to redirects, disambiguation pages, or non-existent articles. Cleaning this data is crucial for accurate analysis. You must resolve redirects to their canonical titles. If [[NYC]] redirects to [[New_York_City]], your analysis should treat them as the same node. Ignoring this step creates fragmented networks that underestimate true connectivity. Additionally, filtering out navigational templates (like sidebar menus) ensures you are analyzing content-based citations rather than structural site elements.
Metrics That Matter: Degree, Betweenness, and Clustering
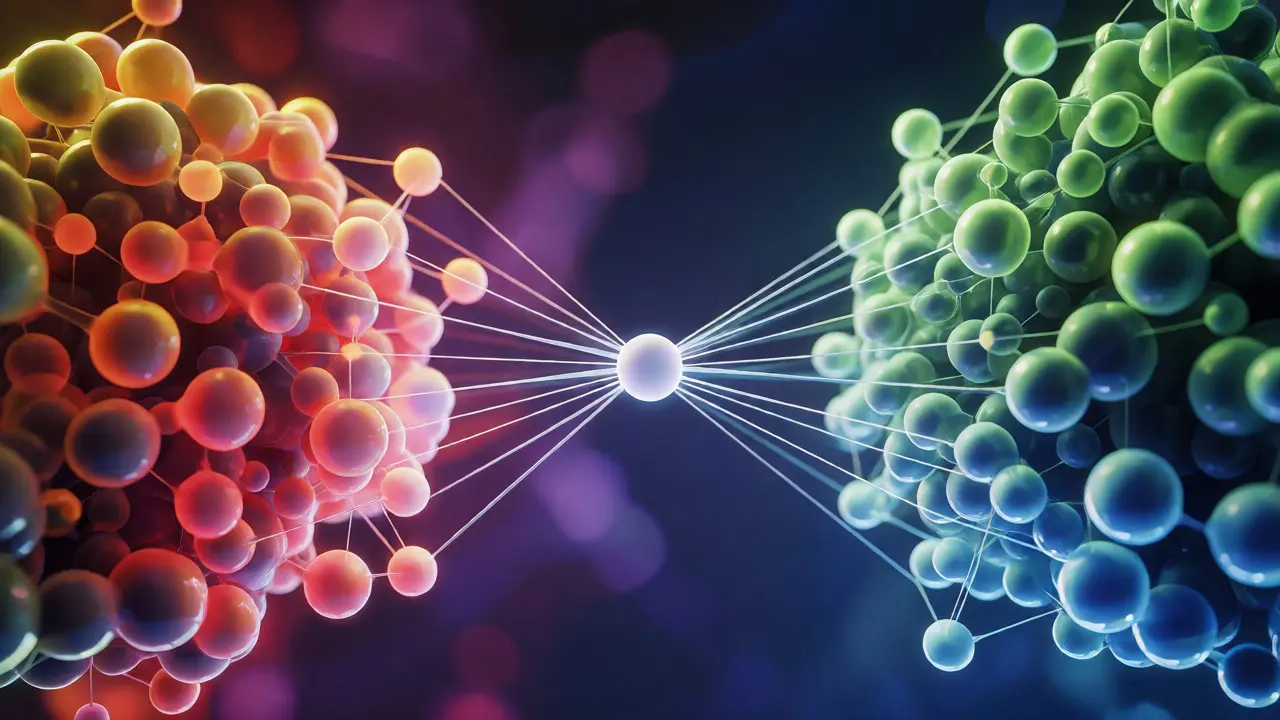
Once you have a clean graph, you apply standard network metrics. Degree Centrality is the simplest starting point. It counts direct connections. But it doesn't tell you about influence. For that, you look at Betweenness Centrality. This metric identifies nodes that act as bridges between different clusters. An article linking "Biology" and "Chemistry" might have lower degree centrality than either field's main hub, but high betweenness if it connects distinct communities.
Clustering Coefficient measures how tightly knit a group of nodes is. High clustering indicates a well-developed topic where related concepts extensively cross-reference each other. Low clustering might suggest a sparse or emerging field. Here is how these metrics compare in practical application:
| Metric | What It Measures | Research Insight | Common Pitfall |
|---|---|---|---|
| Degree Centrality | Number of direct links | Identifies popular or foundational topics | Overlooks indirect influence |
| Betweenness Centrality | Frequency on shortest paths | Finds bridge concepts connecting fields | Computationally expensive for large graphs |
| PageRank | Influence via recursive weighting | Ranks importance considering source quality | Sensitive to initial parameters |
| Clustering Coeff. | Tightness of local neighborhoods | Reveals topic cohesion and maturity | Ignores global network structure |
Case Study: Tracing the Evolution of AI Concepts
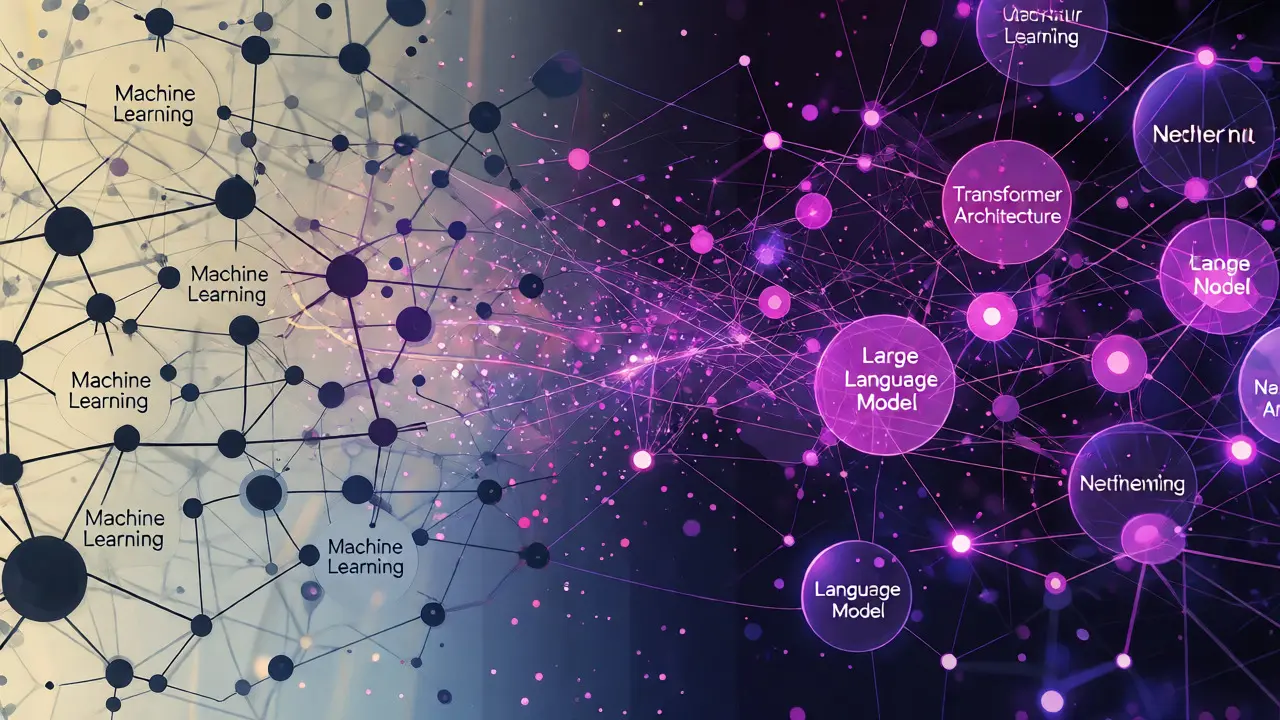
Let's look at a concrete example. Imagine building a citation network around Artificial Intelligence. Initially, the graph might center on broad terms like "Machine Learning" and "Neural Networks." As you filter for recent edits, you notice new hubs emerging, such as "Transformer Architecture" or "Large Language Model."
This shift in centrality tells a story. It shows where attention is moving. Older concepts lose relative centrality not because they are unimportant, but because newer, more specific technologies are drawing links away. You can visualize this evolution by comparing snapshots of the graph from five-year intervals. This temporal analysis helps predict trends before they hit mainstream news cycles. If "Generative Adversarial Networks" suddenly gains high betweenness centrality, it signals growing integration with other fields like art or drug discovery.
Limitations and Biases in Wikipedia Data
No dataset is perfect. Wikipedia suffers from systemic biases. English-language articles dominate, creating a skewed view of global knowledge. Topics covered by active editor communities grow richer networks, while neglected subjects remain isolated islands. Furthermore, vandalism or edit wars can temporarily distort link structures, though bots usually correct these quickly.
Another issue is the "Matthew Effect": rich get richer. Popular articles attract more editors, who add more links, which attracts more readers. This feedback loop can exaggerate the perceived importance of already famous topics. To mitigate this, normalize your data by adjusting for article age or total word count. Always cross-reference your findings with external datasets when making critical claims.
Tools and Libraries for Implementation
You don't need to code everything from scratch. Python offers robust libraries for this work. NetworkX is the standard for graph manipulation. It handles algorithms for centrality, pathfinding, and community detection efficiently. For larger datasets, Graph-tool provides C++ backend performance, speeding up calculations on graphs with millions of edges.
If you prefer visual exploration, tools like Gephi allow you to import CSVs of edges and render interactive maps. Gephi uses force-directed layouts to physically separate clusters, making it easy to spot outliers visually. Combining programmatic analysis with visual inspection often yields the best insights, catching anomalies that pure statistics might miss.
Practical Steps to Start Your Analysis
Ready to try this yourself? Follow this streamlined workflow:
- Define Scope: Choose a seed set of articles. Don't start with all of Wikipedia; pick a domain like "Climate Change" or "Renaissance Art."
- Data Collection: Use the MediaWiki API to fetch links for your seeds. Expand one hop outward to capture immediate neighbors.
- Cleaning: Resolve redirects and remove non-article namespaces (Talk, User, Help).
- Graph Construction: Load nodes and edges into NetworkX. Assign weights if you want to account for link frequency.
- Analysis: Calculate degree and betweenness centrality. Identify top influencers and bridge nodes.
- Visualization: Export the graph to Gephi or plot it with Matplotlib to see the structure.
Beyond Citations: Semantic Similarity
While links are powerful, they don't capture meaning directly. Two articles might be heavily linked due to controversy rather than conceptual similarity. To deepen your analysis, combine citation networks with text mining. Use Natural Language Processing (NLP) to calculate vector similarities between article texts. If two nodes have low link density but high textual similarity, you've found a potential missing link-a gap in the encyclopedia's structure.
This hybrid approach strengthens your findings. It distinguishes between structural dependencies (A requires B to be understood) and thematic co-occurrence (A and B are related topics). Researchers at institutions like MIT have used similar methods to recommend reading paths and improve search engine results, proving that combining graph topology with semantic content leads to superior information retrieval.
Is Wikipedia data reliable for academic research?
Yes, for specific types of research. While individual facts may vary, the aggregate structure of links reflects consensus among thousands of editors. It is excellent for studying information diffusion, topic popularity, and network topology, though less suitable for verifying precise historical dates without cross-referencing primary sources.
How do I handle redirect pages in my citation network?
You must resolve redirects to their target articles. Treat the redirect title and the canonical title as the same node. Failing to do so fragments your network and underestimates the connectivity of major topics. Most API calls include a parameter to automatically follow redirects.
What is the difference between in-degree and out-degree in this context?
In-degree represents how many other articles link to a specific article, indicating its prominence or authority. Out-degree represents how many articles it links to, indicating its breadth or role as an overview page. Both metrics provide different insights into an article's function within the knowledge network.
Can I use Wikipedia links for scientific literature reviews?
It can serve as a preliminary mapping tool. Wikipedia articles often link to key foundational papers. However, it lacks the depth and recency of dedicated databases like PubMed or IEEE Xplore. Use it to identify core concepts and seminal works, then dive deeper into specialized academic repositories.
Which programming language is best for analyzing these networks?
Python is the industry standard due to libraries like NetworkX, Pandas, and Neo4j drivers. R is also effective, particularly for statistical modeling of graph properties. For very large-scale processing, Java or C++ might be necessary, but Python covers most research needs efficiently.