Wikipedia isn’t just a place to look up facts-it’s a living, breathing network of millions of edits made by real people every day. And those edits? They tell a story. Not just about what’s being changed, but who is changing it, when, and why. That’s where data journalism steps in. It turns raw edit logs into visual stories that reveal hidden truths about knowledge, power, and participation online.
What data journalism does with Wikipedia
Data journalism doesn’t just report facts-it finds patterns in the noise. Wikipedia’s public edit history, available through tools like the Wikimedia API, contains over 1.5 billion edits since 2001. Each edit is a timestamped event: who made it, what page was changed, whether it was a minor fix or a full rewrite, and even what device was used. Journalists and researchers mine this data to answer questions like: Are certain topics edited mostly by people in one country? Do women edit less than men? Are some articles locked down by a small group of users?
One 2023 analysis of English Wikipedia edits showed that just 1% of users account for nearly half of all content changes. That’s not democracy-it’s a tight-knit group of volunteers shaping what billions see as truth. Data journalists mapped this concentration, showing how a handful of editors in North America and Western Europe dominate topics like politics, science, and history, while local knowledge from Africa, Southeast Asia, and Latin America gets underrepresented.
Who edits Wikipedia? The numbers don’t lie
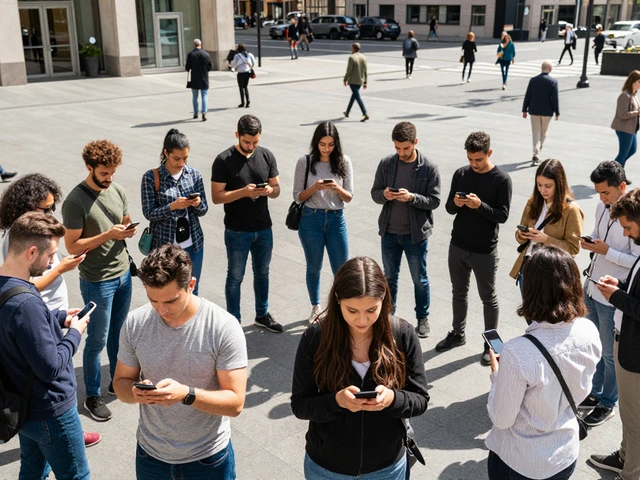
Wikipedia claims to be open to everyone. But the data tells a different story. According to Wikimedia Foundation surveys from 2024, only about 16% of identified editors globally are women. The gap is wider in certain regions: in South Asia, less than 10% of active editors identify as female. Meanwhile, over 60% of editors are under 30, and nearly 70% live in high-income countries.
These aren’t random stats-they shape content. Articles on women scientists, indigenous languages, or African history often have fewer revisions, longer gaps between edits, and more vandalism. Data journalists tracked this by comparing edit frequency and article length across topics. They found that articles about women in STEM were, on average, 37% shorter than comparable articles about men in the same fields. And they stayed that way for years, even after awareness campaigns.
Some edits are subtle. A single word change-like replacing “tribe” with “ethnic group”-can reflect a cultural shift. Others are systemic. A 2022 study showed that articles about U.S. political figures received 4.5 times more edits than those about leaders from non-Western countries, even when those leaders had similar global impact. That’s not bias in one editor’s mind-it’s bias baked into the system by who’s doing the editing.
Visualizing the invisible
Numbers alone don’t move people. That’s where visualization comes in. Data journalists use interactive maps, timelines, and network graphs to make Wikipedia’s invisible labor visible.
One project, called “Edit Atlas,” plotted every edit to the Wikipedia page for “Climate Change” between 2015 and 2025. It showed spikes during UN climate summits, sudden drops during political transitions, and clusters of edits from universities in Germany, Canada, and Australia. It also revealed that edits from mobile devices spiked during protests-suggesting real-time activism was shaping the article as events unfolded.
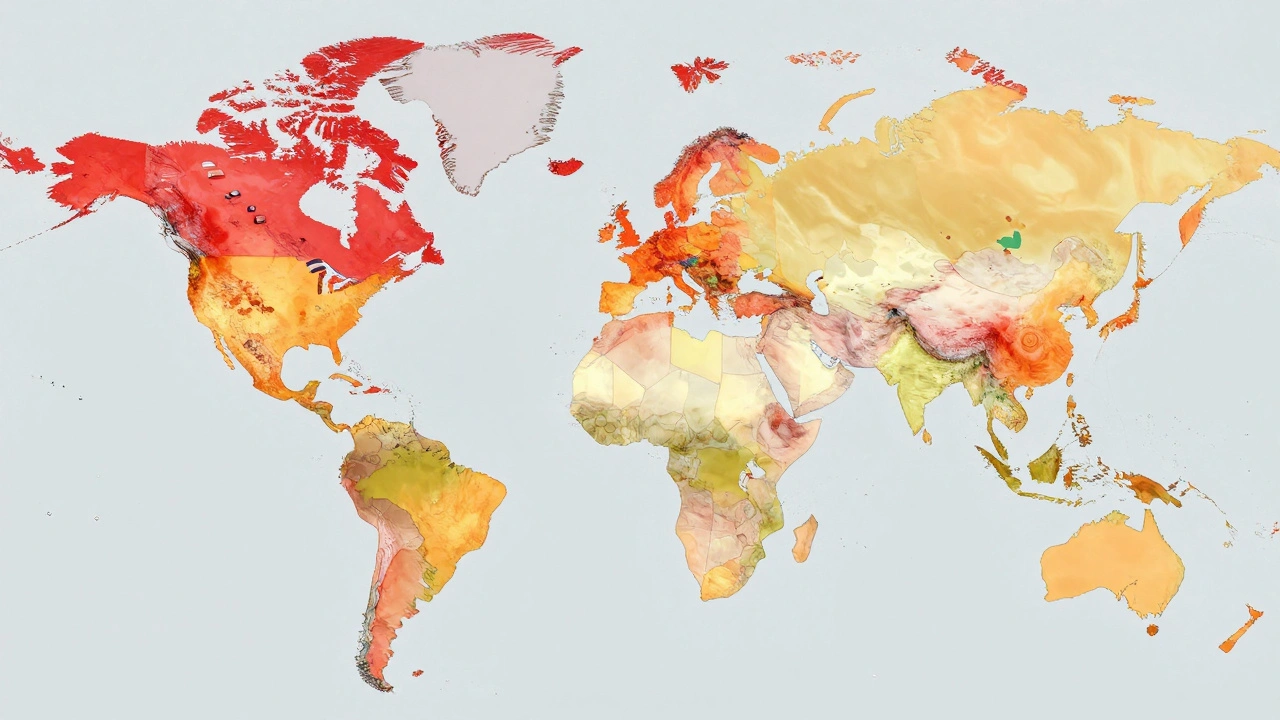
Another tool, “Editor Heatmap,” color-coded regions by edit density. Africa appeared mostly yellow and orange, while North America and Europe glowed red. But when you filtered by article topic, the picture changed. Articles about African wildlife had high edit density from U.S. and U.K. users-not Africans. Meanwhile, articles on local Nigerian festivals were edited mostly by users from Lagos, Abuja, and Port Harcourt, with little outside input.
These visuals aren’t just pretty graphs. They’re evidence. They show who gets heard, who gets silenced, and how knowledge is unevenly distributed-even on a platform built for openness.
How Wikipedia’s structure shapes what we know
Wikipedia’s rules aren’t neutral. The “notability” policy says a topic must have “significant coverage in reliable, independent sources.” But those sources? Most are Western, English-language, and academic. A small town in Bolivia might have vibrant local media, but if those outlets aren’t indexed in Google Scholar or major libraries, the town won’t get a Wikipedia page. Data journalists have used this rule to expose systemic erasure.
In 2024, a team compared the number of Wikipedia pages for cities in India versus cities in Canada. India has 1.4 billion people. Canada has 40 million. Yet, Wikipedia had 1,800 pages for Canadian cities and only 900 for Indian cities-even though India has over 5,000 cities with populations over 100,000. The gap wasn’t due to lack of information. It was due to who had the time, access, and training to create and defend those pages.
Wikipedia’s “verifiability” standard also favors formal writing. A blog post from a community leader might be true, but it’s not “reliable.” A peer-reviewed paper from a university in London? That’s gold. That’s how global knowledge becomes a mirror of privilege.

What’s being done to fix it
It’s not all one-sided. Data journalism has sparked real change. In 2023, the Wikimedia Foundation launched “WikiGap,” a global campaign to increase female editor participation. They partnered with universities, libraries, and media outlets to host edit-a-thons. In Colombia, a group of female journalists trained over 300 students to add biographies of women in politics. Within a year, the number of female political figures on Spanish Wikipedia jumped by 42%.
Other projects use AI to flag under-edited topics. One tool, “Missing Pages,” scans Wikipedia and suggests articles that should exist based on global news coverage and library databases. It’s helped create pages on indigenous artists in Papua New Guinea, women engineers in Kenya, and local folklore in rural Poland.
And it’s not just about adding content-it’s about changing who gets to decide what counts as knowledge. Some groups now use Wikipedia’s “Talk” pages to document why certain edits are biased. They cite local sources, publish translations, and invite community members to join the conversation. Slowly, the system is learning to listen.
Why this matters beyond Wikipedia
Wikipedia is the fifth most visited website in the world. Google pulls from it. Students trust it. Politicians cite it. If the knowledge on Wikipedia is skewed, the world’s understanding of itself is skewed too.
Data journalism gives us the tools to see that. It turns Wikipedia from a static encyclopedia into a dynamic social experiment-one where we can watch bias, power, and participation play out in real time. And it shows us something hopeful: when we see the patterns, we can change them.
Every edit is a choice. And every choice, when seen together, becomes a story. The question isn’t whether Wikipedia is perfect. It’s whether we’re willing to look at the data-and then do something about it.
How do data journalists get Wikipedia edit data?
They use the Wikimedia API, which provides public access to edit histories, user data, and page metadata. Tools like WikiContrib, Quarry, and PetScan help filter and analyze millions of edits. Some journalists combine this with public surveys from the Wikimedia Foundation to match edit patterns with demographic info like gender, location, and age.
Is Wikipedia’s editor base really that unbalanced?
Yes. As of 2024, over 80% of active editors are male, and more than 70% live in high-income countries. The median age is 27. Most edits come from just a few thousand users. This isn’t accidental-it’s the result of systemic barriers like language access, tech literacy, and cultural norms that discourage participation from women, non-Western communities, and older adults.
Can data journalism prove bias in Wikipedia content?
Absolutely. Studies have shown that articles about women, non-Western cultures, and marginalized groups tend to be shorter, updated less often, and more likely to be tagged for cleanup or deletion. Data journalists compare article length, edit frequency, and citation sources across similar topics to reveal these patterns. For example, articles on male scientists average 1,200 words; those on female scientists average 750.
Why doesn’t Wikipedia fix these imbalances on its own?
Wikipedia relies on volunteer editors, and its policies are designed to be neutral-not corrective. While the Wikimedia Foundation runs outreach programs, they can’t force changes. The system rewards technical skill and persistence over diversity. Without external pressure from journalists, researchers, and activists, the imbalance persists because the current system works fine for those already in it.
What can regular people do to help?
Start small. Edit a page about a local figure, add a citation from a local newspaper, or translate a short article into your language. Join a WikiGap edit-a-thon. Report biased edits using Wikipedia’s flagging tools. You don’t need to be an expert-just willing to contribute. Every edit counts, especially when it fills a gap.