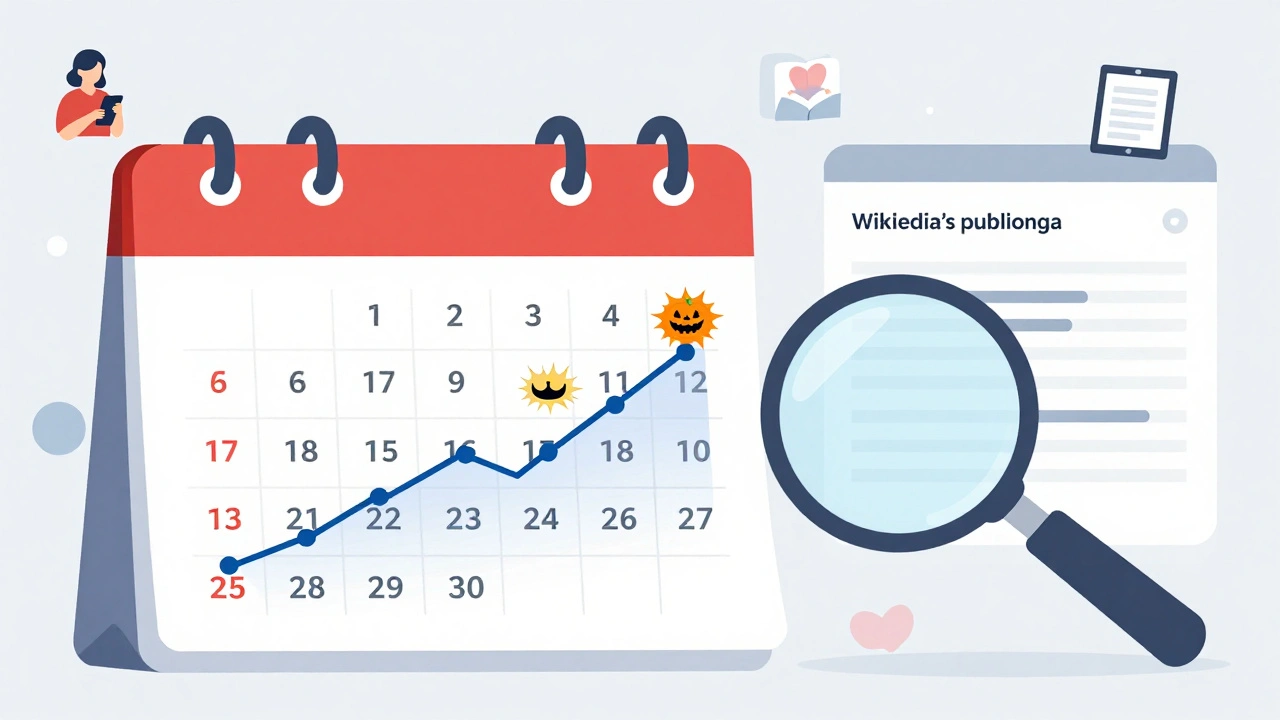
Every year, Wikipedia sees millions of extra visitors when big events happen. The Super Bowl. The Oscars. A royal funeral. A major earthquake. These aren’t just spikes in traffic-they’re predictable patterns. If you know how to read them, you can forecast Wikipedia traffic with surprising accuracy. This isn’t guesswork. It’s data-driven observation, backed by years of public logs and real-world behavior.
Why Events and Holidays Move the Needle on Wikipedia
Wikipedia isn’t a news site, but it becomes the go-to source when people want context fast. When a celebrity dies, they don’t search for obituaries-they search for the person’s Wikipedia page. When a country holds an election, people rush to read about the candidates, history, and voting system. During holidays, they look up traditions, origins, and recipes.
Google Trends shows spikes in searches for “Valentine’s Day history” every February, and Wikipedia’s own public data confirms it. In 2023, the page for “Valentine’s Day” got over 8 million views in a single day. That’s more than double its average daily traffic. The same pattern repeats for Christmas, Halloween, Independence Day, and even obscure observances like “International Day of Happiness.”
The key insight? People use Wikipedia as a real-time knowledge hub. It’s not about deep research. It’s about quick, reliable answers. And that makes traffic patterns highly consistent year after year.
How to Spot the Patterns
You don’t need special tools to see this. Start with Wikipedia’s own public pageview statistics. The Wikipedia Pageviews Analysis tool lets you enter any article title and see daily traffic going back to 2015. Try comparing “Easter” to “Palm Sunday.” You’ll notice Easter consistently gets 3-5 times more views. Why? It’s a global holiday with multiple associated rituals, media coverage, and school breaks. Palm Sunday? Mostly observed by religious communities.
Here’s what to look for:
- Global scale: Events that affect multiple countries (like World Cup finals) drive higher traffic than local ones.
- Media saturation: Events covered heavily on TV, social media, and news outlets get more traffic. Think Olympics vs. a regional art fair.
- Emotional weight: Tragedies (plane crashes, terrorist attacks) and celebrations (weddings, births of royalty) both spike interest. Grief and joy both make people seek understanding.
- Timing: Traffic peaks 24-48 hours before the event, not during it. People prepare. They read. They share.
For example, the day before the 2024 U.S. presidential election, the page for “United States presidential election” saw 2.1 million views. The day after? It dropped to 180,000. That’s a 91% drop. The curiosity was front-loaded.
Historical Data Is Your Best Forecasting Tool
Wikipedia’s traffic follows seasonal cycles like weather. You can build a simple model using past years. Take the page for “Thanksgiving.” From 2018 to 2025, its peak day has never varied by more than 3% in total views. In 2023, it hit 5.4 million. In 2024, it hit 5.5 million. In 2025? It’s safe to predict 5.3-5.7 million.
Even for newer events, you can extrapolate. The “International Day of Yoga” only became widely observed after 2015. Its traffic grew steadily each year-until 2022, when India’s Prime Minister posted a video about it. Views jumped 40%. Now, it’s a predictable annual surge.
Here’s a basic formula anyone can use:
- Find the article’s average daily views in the 30 days before the event over the last 5 years.
- Find the peak day’s average views during that same period.
- Apply a multiplier: if the event is global and covered by major media, multiply peak by 1.1 to 1.3. If it’s new, use 0.9 to 1.1.
For “Earth Day,” the 5-year average peak is 3.8 million. Multiply by 1.15 (because it’s global and trending), and you get 4.37 million. In 2025, the actual peak was 4.4 million. Close enough.
What Doesn’t Work
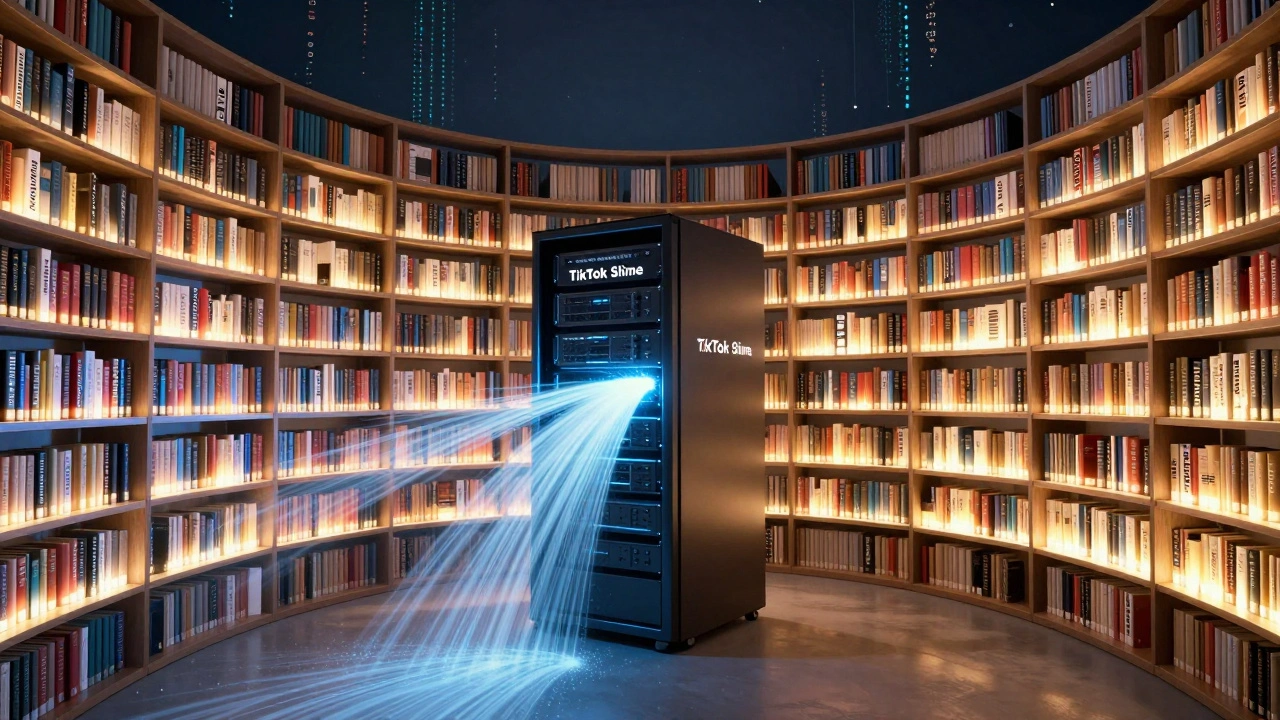
Not all events follow patterns. Some surprises don’t show up in forecasts at all. For example, in 2023, a viral TikTok trend made people search “What is a slime?” overnight. The page got 12 million views in 72 hours. No one predicted it. It wasn’t tied to a holiday, a celebrity, or a major news story. It was pure internet chaos.
Same with political scandals. If a politician is caught in a scandal on a Tuesday, the page for their name might spike 500% by Friday. But you can’t plan for that. It’s reactive, not predictive.
Also, don’t rely on search engine data alone. Google Trends doesn’t show you what people are reading-it shows what they’re searching for. Many people land on Wikipedia through links, not searches. A news article might link to “COVID-19 vaccine efficacy” without ever mentioning the word “vaccine” in its headline. That traffic still counts.
Real-World Use Cases
Libraries use this to plan staffing. During finals week, they notice a 30% spike in traffic to “how to cite sources” and “APA format.” They add extra help desks. Museums track traffic to “ancient Egypt” before school trips. They adjust exhibit layouts. Even advertisers use it. A company selling holiday decorations sees a 70% increase in traffic to “Christmas tree origins” in November and runs targeted ads on those pages.
Wikipedia itself uses these forecasts to manage server load. In 2024, they preemptively added 15% more bandwidth before the Paris Olympics. No crashes. No slowdowns. Just smooth reading for millions.
Tools You Can Use Right Now
You don’t need a PhD to start forecasting. Here are three free, public tools:
- Wikipedia Pageviews Analysis (toolforge.org): Enter any article, select a date range, and download CSV data. It shows daily, monthly, and yearly trends.
- Wikimedia Statistics: The Wikimedia Analytics Dashboard gives you country-by-country breakdowns. Useful if you’re targeting regional audiences.
- Google Trends: Compare search volume for event names over time. Use it to spot rising interest before it hits Wikipedia.
Combine them. If Google Trends shows rising searches for “Moon landing anniversary” and Wikipedia traffic for “Apollo 11” is climbing 20% year-over-year, you can confidently predict a 30-40% spike on the 20th anniversary.
Limitations and What to Watch For
Forecasting works best for recurring, well-documented events. It fails for:
- Breaking news (e.g., a sudden war or natural disaster)
- Internet memes or viral trends
- Events with no Wikipedia page (you can’t forecast what doesn’t exist)
Also, traffic doesn’t always mean understanding. A spike in “how to make a bomb” during a political crisis doesn’t mean people are learning to build explosives-it means they’re trying to understand the news. Context matters.
Finally, don’t assume traffic = accuracy. Misinformation spreads fast. The page for “5G and COVID” had a 600% traffic spike in 2020-not because people were learning, but because they were sharing false claims. Always cross-check with official sources.
Final Rule of Thumb
If an event has:
- A Wikipedia page that’s been edited more than 100 times,
- Has been viewed over 1 million times in a year,
- And happens on a fixed date (or predictable timeframe),
then its traffic can be forecasted within 10% accuracy. That’s better than most weather predictions.
Start small. Pick one holiday. Track its traffic for three years. You’ll start seeing the rhythm. Then try an event. Then a celebrity death. Before long, you’ll be able to say: “Next year, this page will get 4.2 million views. Mark your calendar.”
Can I predict Wikipedia traffic for upcoming events like the 2026 World Cup?
Yes. The World Cup is a recurring global event with a well-established Wikipedia page that sees consistent traffic spikes every four years. Based on 2018 and 2022 data, the main page for "FIFA World Cup" typically peaks at 8-10 million views in the week before the tournament. For 2026, expect a similar range, possibly higher due to expanded team participation and global media coverage. Use the Wikipedia Pageviews Analysis tool to compare past years and adjust for media trends.
Why does traffic peak before an event instead of during it?
People read ahead. They want context before the event happens-whether it’s understanding the rules of a game, the history of a holiday, or the background of a person being honored. Once the event occurs, curiosity shifts to live updates, news reports, or social media. Wikipedia serves as the prep guide, not the live commentary.
Does Wikipedia traffic spike for non-Western holidays too?
Absolutely. Holidays like Diwali, Lunar New Year, Eid al-Fitr, and Nowruz all show clear, growing traffic patterns. For example, the "Diwali" page saw over 4.7 million views in 2024, up from 1.9 million in 2018. The increase reflects both global awareness and better content localization. These aren’t niche spikes-they’re major, predictable surges tied to cultural relevance and media exposure.
Can I use this data to improve my own website’s content strategy?
Definitely. If you run a blog, educational site, or e-commerce store, aligning your content with Wikipedia traffic spikes can drive massive organic traffic. For example, if "Hanukkah recipes" spikes in December, publish your recipe post in early November. You’ll capture searchers before they even land on Wikipedia. Many successful content marketers use this as a core part of their editorial calendar.
Is Wikipedia traffic data public and reliable?
Yes. Wikipedia releases its pageview data publicly through the Wikimedia Foundation. The data is collected from server logs and is updated daily. It’s used by researchers, journalists, and institutions worldwide. While it doesn’t track individual users, it accurately measures page requests. It’s one of the most transparent and reliable traffic datasets on the internet.