Ever wonder why some scientific breakthroughs explode in popularity overnight while others fade into obscurity? It’s not just about press releases. The real story often hides in plain sight: Wikipedia pageviews are a raw, unfiltered snapshot of what the world is actually curious about at any given second. When a major discovery hits the news, millions of people don’t just read the headline-they click through to learn more. And where do they go first? Almost always, it’s Wikipedia.
This behavior creates a fascinating dataset for analysts, journalists, and scientists alike. By tracking spikes in traffic patterns, we can see exactly how the public processes complex information. Did a new exoplanet discovery cause a surge in searches for "habitable zone"? Did a medical trial result drive people to the page for "CRISPR"? These aren't random clicks; they are measurable reactions to science happening in real time.
Why Wikipedia Is the Ultimate Barometer for Science
Think about your own habits. You hear about a new vaccine or a climate report on the evening news. Your brain instantly asks, "What does this mean for me?" You pull out your phone, type the term into a search bar, and the first link you usually trust-or at least check-is Wikipedia. This isn't accidental. Wikipedia has become the default "first stop" for contextualizing breaking news.
Unlike social media, which is noisy and algorithm-driven, Wikipedia traffic is driven by intent. People go there to understand definitions, history, and mechanics. For scientific discoveries, this distinction matters. A viral tweet might get likes, but a spike in Wikipedia views shows genuine comprehension attempts. Researchers call this "curiosity metrics." It tells us not just what people saw, but what they wanted to know.
Consider the difference between a passive view and an active search. Social platforms track impressions-how many times a post appeared on a screen. Wikipedia tracks sessions-how many times someone actively sought out information. That makes the latter far more valuable for gauging true public engagement with topics like quantum computing or genomic editing.
Anatomy of a Discovery Spike
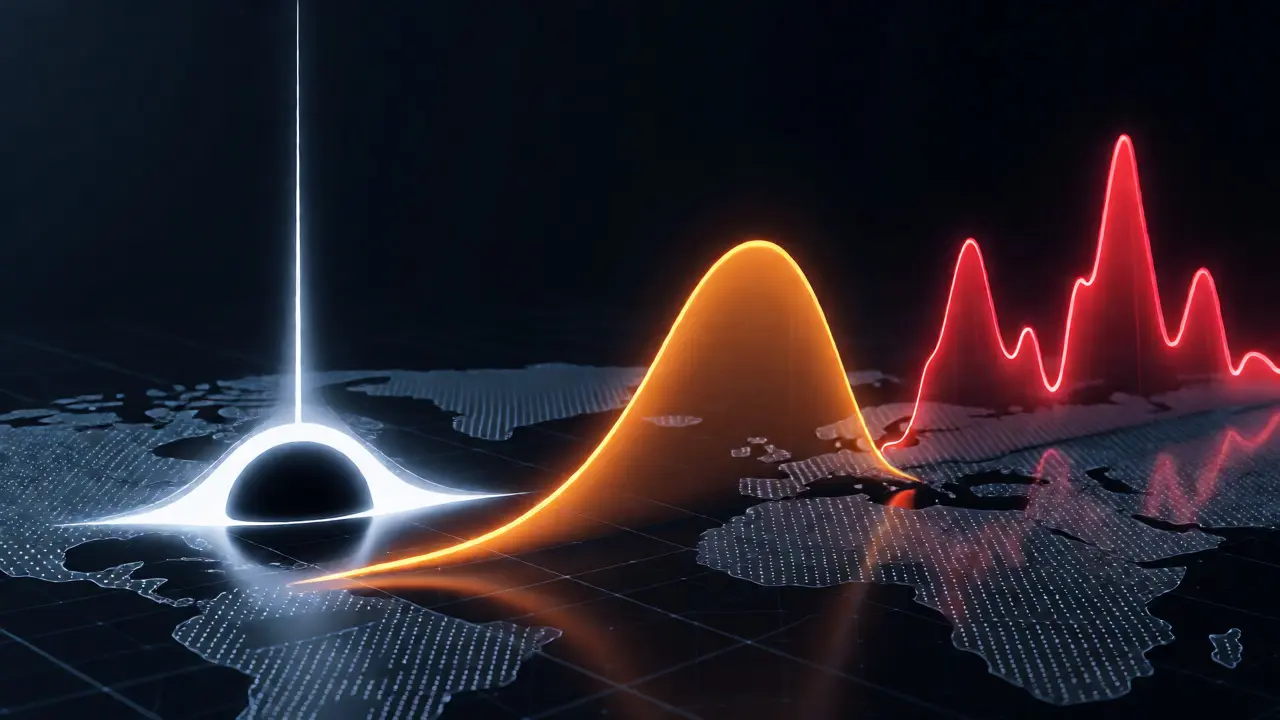
Not all scientific news triggers the same kind of traffic wave. We have observed distinct patterns depending on the nature of the discovery. Understanding these shapes helps predict how future announcements might land.
First, there is the "Instant Shock" pattern. This happens when a discovery is visually striking or emotionally resonant. Think of the first black hole image released by the Event Horizon Telescope. Traffic didn't just rise; it skyrocketed within minutes of the announcement. Why? Because the image was shareable, understandable, and awe-inspiring. Users clicked to see the picture, then stayed to read about supermassive black holes.
Second, we see the "Slow Burn" pattern. This occurs with complex theoretical advancements, such as updates to string theory or subtle shifts in particle physics. Initial traffic is low because the concept is hard to grasp. But over days or weeks, as educators and bloggers explain it, views creep upward. This lag reveals that the public needs translation before engagement. If you're communicating science, this tells you that jargon kills immediate interest but clear analogies sustain it.
Third, the "Controversy Curve" appears when findings challenge established norms. Climate change reports or debates over AI safety often trigger polarized traffic. Users visit not just to learn, but to verify claims against their existing beliefs. Here, Wikipedia serves as a neutral ground-a place to check facts amidst heated online arguments.
Case Studies in Digital Curiosity
Let's look at specific examples from recent years to see how these patterns play out in the real world. Data from the Wikimedia Foundation provides clear evidence of how different types of science capture attention.
| Event Type | Peak Timeframe | Traffic Characteristic | Primary User Intent |
|---|---|---|---|
| Visual Astronomy (e.g., Black Hole Image) | Hours after release | Sharp, high-volume spike | Verification & Visual Confirmation |
| Medical Breakthroughs (e.g., mRNA Vaccines) | Days following approval | Sustained elevated baseline | Safety & Mechanism Explanation |
| Theoretical Physics (e.g., Gravitational Waves) | Weeks after publication | Gradual increase, long tail | Contextual Understanding |
| Environmental Reports (e.g., IPCC Findings) | Immediate + Recurring | Pulsed spikes during news cycles | Fact-Checking & Policy Impact |
Take the James Webb Space Telescope launches and subsequent images. Each new image release caused massive surges in views for related articles like "Infrared astronomy" and "Exoplanets." Unlike previous telescopes, JWST data was presented in ways that non-scientists could appreciate immediately. The traffic wasn't just looking at the telescope itself; it was branching out into child entities like "stellar nurseries" and "cosmic expansion." This demonstrates how one central entity can drive broad semantic exploration.
Contrast this with the ongoing developments in Artificial Intelligence. While AI is technically computer science, its intersection with biology (like AlphaFold) created unique traffic patterns. When DeepMind announced protein structure predictions, traffic to "Protein folding" jumped. But unlike astronomy, the interest remained high for months. Why? Because the implications were practical. Biologists, students, and tech enthusiasts kept returning to update their knowledge. This sustained interest suggests that applied science generates longer-term engagement than pure observation.
Geographic and Demographic Nuances
It’s easy to assume science is global, but interest varies wildly by region. Wikipedia data allows us to filter traffic by country and language, revealing cultural priorities. For instance, countries with strong renewable energy sectors, like Germany or Denmark, show higher relative interest in "Solar cell efficiency" compared to nations reliant on fossil fuels. This isn't just policy; it's public curiosity.
Language also plays a huge role. English-language Wikipedia pages generally receive the most traffic, but local-language editions reveal niche interests. In Japan, traffic to robotics-related science pages often exceeds global averages. In Brazil, biodiversity and Amazon rainforest studies draw disproportionate attention. These regional differences help researchers tailor outreach efforts. If you're promoting a study on marine conservation, targeting Portuguese-speaking audiences might yield better engagement than a generic global push.
Demographics matter too. Younger users tend to cluster around tech-heavy topics like CRISPR and AI, while older demographics show steady interest in health-related discoveries. However, the lines are blurring. During the pandemic, health literacy surged across all age groups, leading to unprecedented traffic on basic biological terms like "RNA" and "Antibody." This shift showed that crisis drives rapid educational uptake.
Using Traffic Data for Better Communication
So, what should you do with this information? If you're a scientist, journalist, or educator, understanding these patterns changes how you communicate. First, timing is everything. If your discovery is visual, pair it with high-quality imagery right away. If it's complex, prepare explanatory content *before* the announcement. Don't wait for the confusion to set in.
Second, anticipate the questions. Look at the "Related Articles" section of your topic's Wikipedia page. Where did traffic flow next? If people reading about "Quantum Computing" immediately click on "Qubit," make sure that connection is clear in your summary. Use the semantic map of Wikipedia to guide your narrative. Link concepts naturally rather than forcing them.
Third, monitor the decay rate. How quickly does interest drop off? If traffic plummets after two days, your message might have been too narrow. If it stays flat, you might need a follow-up story. Successful science communication often involves a series of touchpoints, each addressing a deeper layer of complexity revealed by initial user queries.
The Future of Tracking Scientific Interest
As we move further into 2026, the landscape is changing. Voice search and AI assistants are altering how people access information. Are people still typing "what is fusion energy" into Google, or are they asking Siri? Early indicators suggest that while voice search grows, direct navigation to authoritative sources like Wikipedia remains robust for deep dives. Voice answers often cite Wikipedia summaries, creating a feedback loop that reinforces its status as a primary source.
We are also seeing more integration between academic databases and public encyclopedias. Initiatives to improve citation quality mean that when you click a reference in a Wikipedia article, you're more likely to land on a peer-reviewed paper. This bridges the gap between public curiosity and professional research. The ultimate goal is transparency-making science accessible without diluting accuracy.
For now, keep watching the numbers. They tell a story no press release can. They show us not just what scientists discover, but what humanity cares enough to ask about.
Why is Wikipedia used to measure scientific interest?
Wikipedia receives billions of monthly visits, making it a massive, diverse sample of public curiosity. Unlike social media metrics, which can be influenced by bots or algorithms, Wikipedia views reflect active information-seeking behavior. When people want to understand a complex topic, they turn to Wikipedia, providing a reliable signal of genuine interest.
Do all scientific discoveries cause traffic spikes?
No. Only discoveries with broad appeal, visual elements, or direct personal relevance typically cause significant spikes. Niche theoretical papers may see minimal traffic increases unless picked up by mainstream media or explained by popular science communicators. The complexity of the subject and its accessibility heavily influence traffic volume.
How soon after a discovery does traffic peak?
For high-profile events, peaks often occur within hours of the main announcement or press conference. However, for complex topics, the peak may happen days later once news outlets publish explanatory articles. There is often a secondary, smaller peak if controversial aspects emerge or if follow-up studies are published.
Can Wikipedia traffic predict stock market movements?
Sometimes. Surges in interest for technologies like battery storage or gene therapy can correlate with increased investor attention. However, it is not a perfect predictor. Public curiosity does not always translate to immediate financial action, but it can indicate growing market awareness or sentiment shifts among retail investors.
Is Wikipedia data accurate for non-English speakers?
Yes, but it requires separate analysis. Non-English Wikipedias have their own traffic patterns. Ignoring them skews global data. Researchers must aggregate data from multiple language editions to get a true global picture, as interest levels vary significantly by culture and language availability.