Have you ever wondered why some Wikipedia pages feel like stable encyclopedic entries while others read like battlegrounds? You might have noticed that certain articles-often about politics, controversial historical figures, or breaking news-seem to change every few minutes. Behind these rapid changes is a hidden layer of data that reveals the intensity of human disagreement. This is where conflict heatmaps come into play.
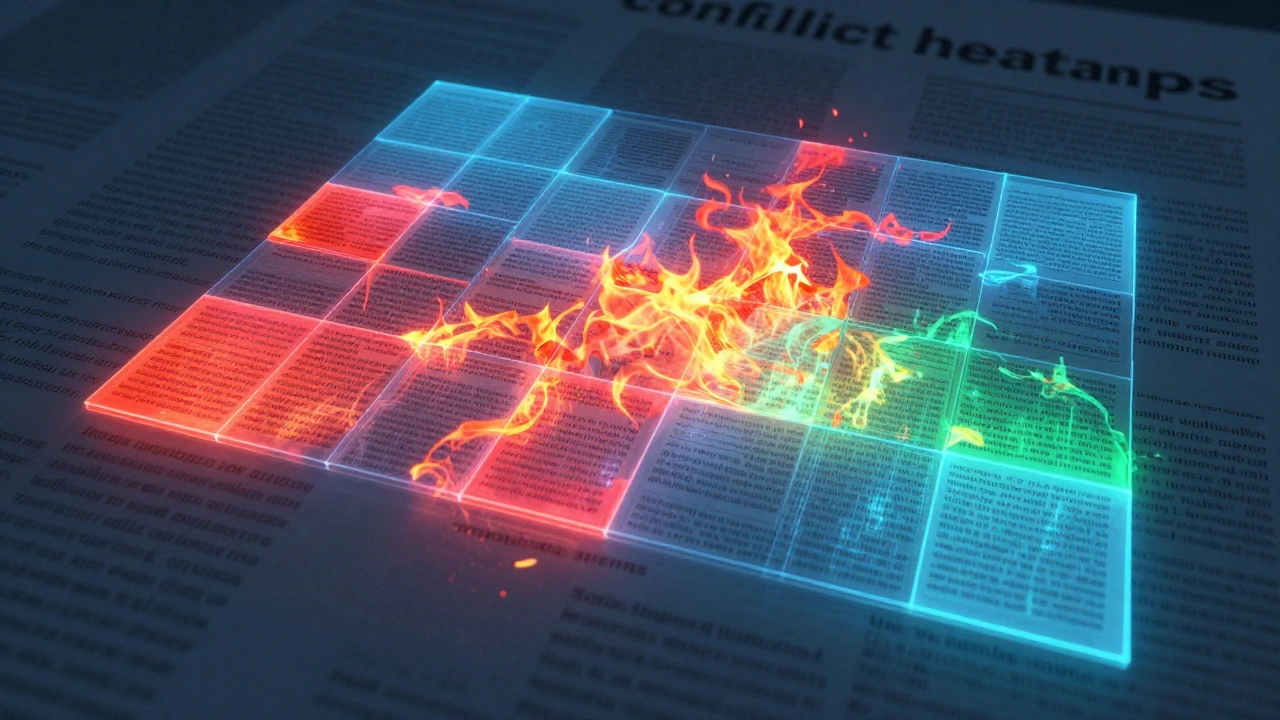
A conflict heatmap is not just a pretty chart; it is a visualization tool that maps the frequency and intensity of edits on specific articles over time. By highlighting areas of high contention, these heatmaps offer a unique window into the mechanics of collaborative knowledge production, which is the process by which large groups of people work together to create shared information resources. For researchers, editors, and curious readers alike, understanding these patterns helps demystify how truth is negotiated in a decentralized environment.
What Exactly Is a Conflict Heatmap?
To understand the value of a heatmap, we first need to look at what constitutes "conflict" on Wikipedia. In this context, conflict isn't always heated arguments in talk pages (though those exist). It is primarily measured through edit wars, which are sequences of rapid, opposing edits between users who disagree on the content or tone of an article. When User A adds a sentence, User B removes it, and User A re-adds it, the system logs this as a reversion.
A heatmap aggregates these events. Imagine a grid where the X-axis represents time (days or months) and the Y-axis represents specific articles or sections within an article. The color intensity-usually ranging from cool blues to fiery reds-indicates the volume of contested edits. Dark red zones signal periods of intense dispute, while green or blue areas indicate stability. This visual representation allows us to see trends that raw numbers cannot convey, such as whether a controversy flares up seasonally or persists indefinitely.
The Mechanics Behind the Visualization
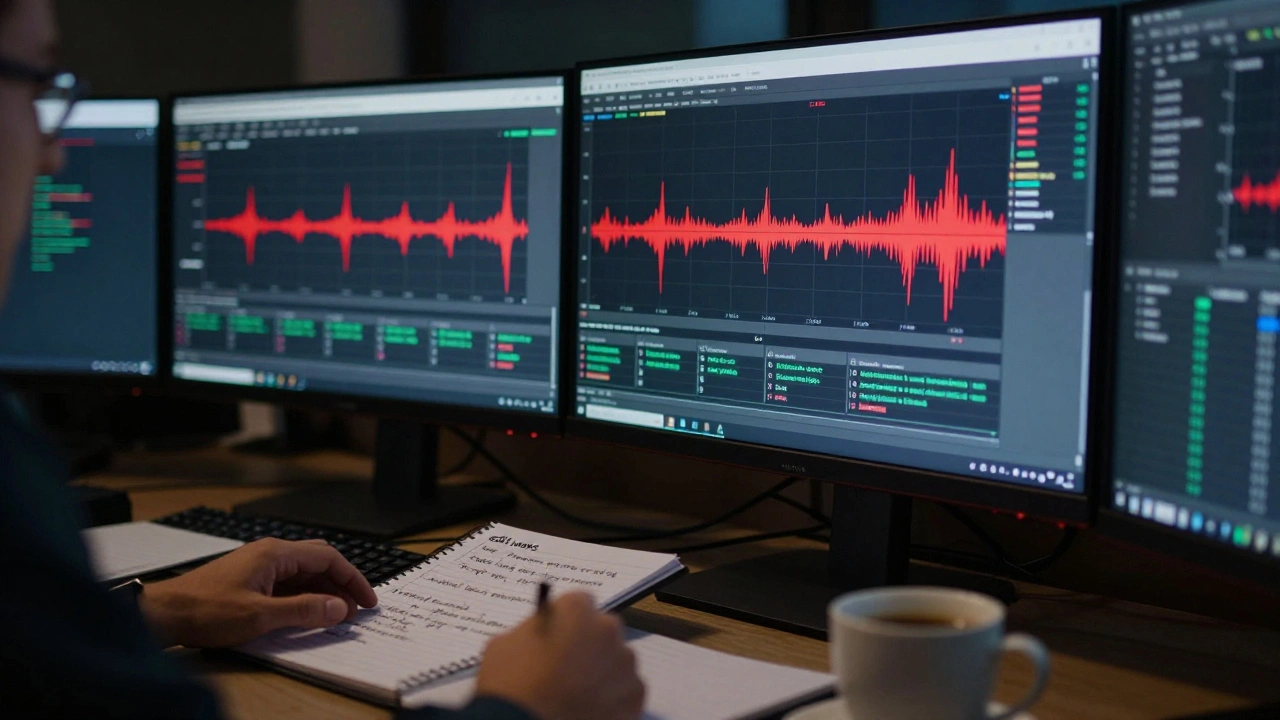
Creating these heatmaps requires sifting through massive datasets. Wikipedia stores its entire history in public databases, known as Wiki dumps, which are periodic backups of all content and metadata stored on the platform. Researchers extract this data using tools like Pywikibot, a software library written in Python that allows developers to automate tasks on MediaWiki-based sites. By scripting bots to identify revert patterns, analysts can quantify the "heat" of any given page.
The algorithm typically looks for three key signals:
- Revert Rate: How often is an edit undone within a short timeframe?
- Editor Diversity: Are many different users involved, or is it a two-person tug-of-war?
- Topic Sensitivity: Does the article fall under categories marked as "contentious" by the community?
When these factors combine, the heatmap lights up. This technical backbone ensures that the visualization is not subjective but based on observable behavioral data.
Why Do Certain Articles Burn Hotter?
If you look at a global conflict heatmap for Wikipedia, certain topics consistently stand out. Political figures, religious controversies, and geopolitical conflicts dominate the red zones. Why? Because these topics trigger identity-protective cognition, a psychological phenomenon where individuals reject information that threatens their social or political identity. On Wikipedia, this manifests as editors fighting to ensure their preferred narrative is reflected.
For example, articles related to ongoing military conflicts often experience spikes in editing activity corresponding to real-world events. A ceasefire announcement might lead to a sudden calm (blue zone), followed by renewed violence and a surge in disputed edits (red zone). Similarly, election cycles cause predictable waves of contention around candidate biographies. These patterns show that Wikipedia is not a static archive but a living mirror of societal tensions.
The Role of Governance and Protection
When a heatmap shows sustained high heat, the Wikipedia community doesn’t just watch it burn. They intervene. This is where page protection comes into play. If an article becomes too contentious, administrators may lock it, allowing only experienced editors to make changes. This action usually causes the heatmap to cool down dramatically, as the barrier to entry rises.
However, protection is a double-edged sword. While it stops vandalism and edit wars, it can also freeze the article in place, preventing new, verified information from being added quickly. This creates a tension between stability and accuracy. Some advocates argue for more nuanced approaches, such as semi-protection, which blocks new accounts but allows established users to contribute. The effectiveness of these measures is often debated in the Village Pump, the central discussion forum for Wikipedia policy matters.
| Protection Level | Who Can Edit? | Impact on Heatmap | Best Use Case |
|---|---|---|---|
| Unprotected | Everyone | High volatility possible | Stable, non-controversial topics |
| Semi-Protected | Registered users (4+ days) | Moderate reduction in noise | Recent events, minor disputes |
| Fully Protected | Administrators only | Sharp drop in activity | Severe edit wars, high-profile targets |
Visualizing Bias Through Time
Beyond immediate disputes, heatmaps help researchers study long-term bias. By analyzing years of data, scholars can see if certain perspectives dominate during specific periods. For instance, a study might reveal that articles about women scientists receive more contested edits when they challenge traditional gender roles. This longitudinal view turns the heatmap into a tool for sociological analysis, not just site maintenance.
This approach aligns with the concept of digital humanities, which uses computational methods to analyze cultural artifacts. In this case, the artifact is the encyclopedia itself. By mapping conflict, we map the underlying values and biases of the editor base. It’s a powerful way to hold the platform accountable to its own goal of neutrality.
Tools for Viewing and Creating Heatmaps
You don’t need to be a data scientist to explore these patterns. Several tools exist for visualizing Wikipedia data. Wikidata, the structured knowledge base behind Wikipedia, provides APIs that allow developers to pull edit histories easily. Additionally, platforms like OpenStreetMap and other open-data initiatives often share methodologies for handling spatial and temporal data, which can be adapted for text-based conflict mapping.
For casual users, extensions like Gadget:EditCounter provide basic insights into user activity, though they don’t generate full heatmaps. More advanced users might turn to Tableau or Power BI, general-purpose data visualization software, to import Wikipedia dump files and create custom dashboards. These tools allow you to filter by topic, date range, and editor tenure, giving you granular control over what you see.
The Future of Content Governance
As AI becomes more integrated into content creation, the nature of conflict on Wikipedia will likely change. Automated bots already handle routine tasks, but they can also inadvertently fuel disputes if their programming contains biases. Future heatmaps may need to distinguish between human-driven and bot-driven edits to provide accurate pictures of contention. This evolution underscores the importance of transparent algorithms and ethical guidelines in algorithmic governance, the use of automated systems to manage digital communities.
Ultimately, conflict heatmaps serve as a diagnostic tool. They don’t solve disagreements, but they highlight where attention is needed most. By making the invisible visible, they empower the community to protect the integrity of one of the world’s most valuable knowledge resources.
How do I access Wikipedia’s edit history data?
You can access Wikipedia’s edit history through the Wikimedia Foundation’s public database dumps. These are available via FTP or HTTP mirrors. For smaller-scale queries, you can use the Wikipedia API, which allows you to retrieve revision histories for specific pages programmatically.
What defines an "edit war" on Wikipedia?
An edit war is generally defined as a series of rapid reversions where two or more editors repeatedly undo each other’s changes. Wikipedia’s "Three Reverts Rule" states that reverting the same change more than three times in 24 hours is prohibited, helping to curb these conflicts.
Can anyone create a conflict heatmap?
Yes, anyone with basic programming skills can create a conflict heatmap. You’ll need to extract data using tools like Pywikibot or the Wikipedia API, process it to identify revert patterns, and then visualize it using libraries like Matplotlib, D3.js, or Tableau.
Why are political articles more contested?
Political articles are often more contested because they involve sensitive topics that touch on personal identities and beliefs. Editors may have strong opinions about how political figures or events should be portrayed, leading to frequent disputes over neutrality and sourcing.
Does page protection stop all editing?
No, page protection does not stop all editing. Semi-protection allows registered users to edit, while full protection restricts editing to administrators. This ensures that trusted contributors can still improve the article while preventing disruptive behavior from anonymous or new accounts.
